Chapter 8: Normalized Difference Vegetation Index
This chapter provides a workflow to demonstrate the Normalized Difference Vegetation Index (NDVI) for snow-on and snow-off conditions in Rocky Mountain National Park, Colorado, United States. The full GEE code can be found here.
Background
We can exploit channels in portions of the electromagnetic spectrum to create indices that we can use to enhance our understanding of the status of the land surface. The most popular of of these, the Normalized Difference Vegetation Index (NDVI), uses the strong contrast between the red and the near-infrared for healthy green vegetation. This index is expressed as:
We can however use additional sensor channels and combinations of channels as well as linear-transformations to create enhance our ability to interpret and understand land surface conditions. As an example, consider the Enhanced Vegetation Index (EVI) developed by Alfredo Huete [2] in 1994:
This index minimizes saturation and background effects in the NDVI. The EVI can be implemented in GEE using the image.expression method. We would “connect” the NIR, Red, and Blue variables in the expression to the correct Landsat TM channels via the image.select method:
var evi = image.expression(
  '2.5 * ((NIR - RED) / (NIR + 6 * RED - 7.5 * BLUE + 1))', {
    'NIR': image.select('B4'),
    'RED': image.select('B3'),
    'BLUE': image.select('B2')
});
Fig. 1 provides an example spectra.
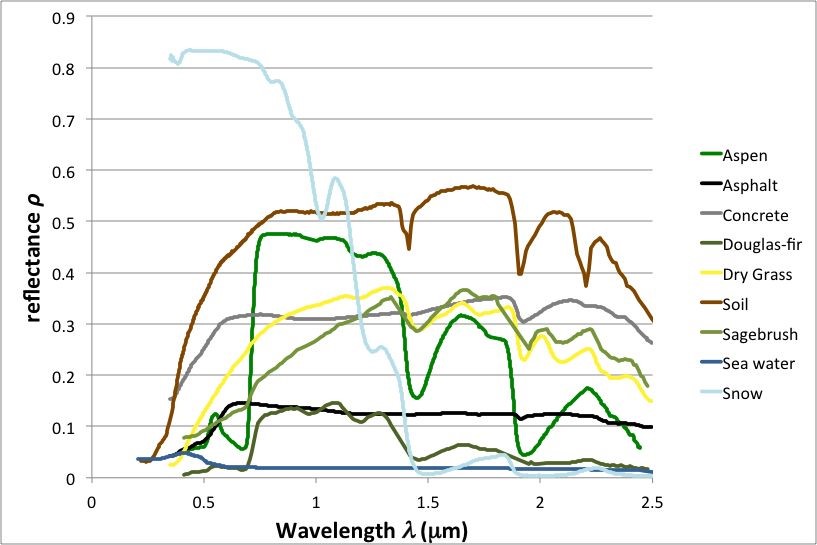
Fig. 1 Typical earth surface spectra in the visible to mid-infrared portion of the electromagnetic spectrum. Source: Google Earth Engine Team.
Data Acquisition & Preprocessing
// Define boundary for Rocky Mountain National Park, Colorado (from GEE Asset)
var rmnp_boundary = ee.FeatureCollection("users/calekochenour/Rocky_Mountain_National_Park__Boundary_Polygon");

// Landsat 8
// Define Landsat 8 collection
var landsat8_t1_sr = ee.ImageCollection('LANDSAT/LC08/C01/T1_SR');

// Filter Landsat 8 Tier 1 SR to snow-on conditions near RMNP, 2018
var co_snow_on_2018_l8 = landsat8_t1_sr
  .filterDate('2018-03-01', '2018-04-30')
  .filterBounds(rmnp_boundary)
  .sort('CLOUD_COVER')
  .first();

// Filter Landsat 8 Tier 1 SR to snow-off conditions near RMNP, 2018
var co_snow_off_2018_l8 = landsat8_t1_sr
  .filterDate('2018-07-01', '2018-08-31')
  .filterBounds(rmnp_boundary)
  .sort('CLOUD_COVER')
  .first();

// Clip snow-on and snow-off imagery (Landsat 8) to RMNP boundary
var rmnp_snow_on_2018_l8 = co_snow_on_2018_l8.clip(rmnp_boundary);
var rmnp_snow_off_2018_l8 = co_snow_off_2018_l8.clip(rmnp_boundary);

// Sentinel-2
// Define Sentinel-2 collection
var sentinel2_level2a = ee.ImageCollection("COPERNICUS/S2_SR");

// Filter Sentinel-2 Level 2A to snow-on conditions near RMNP, 2019
var co_snow_on_2019_s2 = sentinel2_level2a
  .filterDate('2019-03-01', '2019-04-30')
  .filterBounds(rmnp_boundary)
  .sort('CLOUDY_PIXEL_PERCENTAGE')
  .first();

// Print image to console; explore bands and properties
print(co_snow_on_2019_s2, "Sentinel-2 On");

// Get list of all bands
var s2_band_names = co_snow_on_2019_s2.bandNames();
print('Band names: ', s2_band_names);

// Get a specific band
var s2_red = co_snow_on_2019_s2.select('B4');
// var s2_red_nir = co_snow_on_2019_s2.select(['B4', 'B8']); For multiple bands
print(s2_red, "Sentinel-2 Red Band");

// Get a list of all metadata properties
var s2_properties = co_snow_on_2019_s2.propertyNames();
print('Sentinel-2 Metadata properties: ', s2_properties);

// Get a specific metadata property
var cloudiness = co_snow_on_2019_s2.get('CLOUD_COVERAGE_ASSESSMENT');
print('CLOUD_COVER_ASSESSMENT: ', cloudiness);

// Get a specific metadata property
var cloudiness = co_snow_on_2019_s2.get('CLOUDY_PIXEL_PERCENTAGE');
print('CLOUDY_PIXEL_PERCENTAGE: ', cloudiness);

// Get the timestamp and convert to date
var date = ee.Date(co_snow_on_2019_s2.get('system:time_start'));
print('Timestamp: ', date);
print('Timestamp Object Type: ', date.name());

// Filter Sentinel-2 Level 2A to snow-off conditions near RMNP, 2019
var co_snow_off_2019_s2 = sentinel2_level2a
  .filterDate('2019-07-01', '2019-08-31')
  .filterBounds(rmnp_boundary)
  .sort('CLOUDY_PIXEL_PERCENTAGE')
  .first();

// Print image to console; explore bands and properties
print(co_snow_off_2019_s2, "Sentinel-2 Snow Off");

// Clip snow-on and snow-off imagery (Sentinel-2) to RMNP boundary
var rmnp_snow_on_2019_s2 = co_snow_on_2019_s2.clip(rmnp_boundary);
var rmnp_snow_off_2019_s2 = co_snow_off_2019_s2.clip(rmnp_boundary);
Data Processing
// Calculate NDVI for Landsat 8
var rmnp_ndvi_snow_on_l8 = co_snow_on_2018_l8
  .normalizedDifference(['B5', 'B4'])
  .clip(rmnp_boundary);

var rmnp_ndvi_snow_off_l8 = co_snow_off_2018_l8
  .normalizedDifference(['B5', 'B4'])
  .clip(rmnp_boundary);

// Calculate NDVI for Sentinel-2
var rmnp_ndvi_snow_on_s2 = co_snow_on_2019_s2
  .normalizedDifference(['B8', 'B4'])
  .clip(rmnp_boundary);

var rmnp_ndvi_snow_off_s2 = co_snow_off_2019_s2
  .normalizedDifference(['B8', 'B4'])
  .clip(rmnp_boundary);
// print(rmnp_ndvi_snow_off_s2, "Sentinel-2 Snow Off NDVI");
Data Postprocessing
// No data postprocessing in this lab.
Data Visualization
// Define Landsat 8 RGB visualization parameters
var l8_vis_params_rgb = {
  'bands': ['B4', 'B3', 'B2'],
  'min': 0,
  'max': 3000
};

// Define Landsat 8 CIR visualization parameters
var l8_vis_params_cir = {
  'bands': ['B5', 'B4', 'B3'],
  'min': 0,
  'max': 3000
};

// Define Sentinel-2 RGB visualization parameters
var s2_vis_params_rgb = {
  'bands': ['B4', 'B3', 'B2'],
  'min': 0,
  'max': 3000
};

// Define Sentinel-2 CIR visualization parameters
var s2_vis_params_cir = {
  'bands': ['B8', 'B4', 'B3'],
  'min': 0,
  'max': 3000
};

// Define NDVI visualization parameters
var vis_params_ndvi = {
  'min': -1,
  'max': 1,
  // palette: ['blue', 'white', 'green']
 'palette': ['red', 'yellow', 'green']
};

// Define RMNP boundary visualization parameters
var empty = ee.Image().byte();

var rmnp_boundary_vis = empty.paint({
  featureCollection: rmnp_boundary,
  color: 1,
  width: 3
});

// Center map to Rocky Mountain National Park, Colorado
Map.setCenter(-105.6836, 40.3428, 10);

// Add snow-on and snow-off images to map, Landsat 8, RGB and CIR
Map.addLayer(
  rmnp_snow_on_2018_l8,
  l8_vis_params_rgb,
  'Landsat 8 - RGB - 2018 - RMNP - Snow On');

Map.addLayer(
  rmnp_snow_on_2018_l8,
  l8_vis_params_cir,
  'Landsat 8 - CIR - 2018 - RMNP - Snow On');

Map.addLayer(
  rmnp_snow_off_2018_l8,
  l8_vis_params_rgb,
  'Landsat 8 - RGB - 2018 - RMNP - Snow Off');

Map.addLayer(
  rmnp_snow_off_2018_l8,
  l8_vis_params_cir,
  'Landsat 8 - CIR - 2018 - RMNP - Snow Off');

// Add snow-on and snow-off images to map, Sentinel-2, RGB and CIR
Map.addLayer(
  rmnp_snow_on_2019_s2,
  s2_vis_params_rgb,
  'Sentinel-2 - RGB - 2019 - RMNP - Snow On');

Map.addLayer(
  rmnp_snow_on_2019_s2,
  s2_vis_params_cir,
  'Sentinel-2 - CIR - 2019 - RMNP - Snow On');

Map.addLayer(
  rmnp_snow_off_2019_s2,
  s2_vis_params_rgb,
  'Sentinel-2 - RGB - 2019 - RMNP - Snow Off');

Map.addLayer(
  rmnp_snow_off_2019_s2,
  s2_vis_params_cir,
  'Sentinel-2 - CIR - 2019 - RMNP - Snow Off');

// Add NDVI to map
Map.addLayer(
  rmnp_ndvi_snow_on_l8,
  vis_params_ndvi,
  'Landsat 8 - NDVI - 2018 - RMNP - Snow On'
);

Map.addLayer(
  rmnp_ndvi_snow_off_l8,
  vis_params_ndvi,
  'Landsat 8 - NDVI - 2018 - RMNP - Snow Off'
);

Map.addLayer(
  rmnp_ndvi_snow_on_s2,
  vis_params_ndvi,
  'Sentinel-2 - NDVI - 2019 - RMNP - Snow On'
);

Map.addLayer(
  rmnp_ndvi_snow_off_s2,
  vis_params_ndvi,
  'Sentinel-2 - NDVI - 2019 - RMNP - Snow Off'
);

// Add RMNP boundary to map
Map.addLayer(
  rmnp_boundary_vis,
  {'palette': 'FF0000'},
  'RMNP Boundary');
Data Export
// No data export in this lab.